# turn the data into a format suitable for dendrograms #palms <- palmtrees %>%group_by(palm_subfamily) %>%arrange(palm_subfamily) %>%mutate(level1 ="palmcenter",level2 = palm_subfamily,level3 = palm_tribe,level4 = spec_name) %>%ungroup() %>%select(level1:level4)# create the edges #palms_edges_1_2 <- palms %>%select(level1, level2) %>%unique() %>%rename(from = level1, to = level2) %>%mutate(subfam = to) # adding this column for colour groupingpalms_edges_2_3 <- palms %>%select(level2, level3) %>%unique() %>%rename(from = level2, to = level3) %>%mutate(subfam = from) # adding this column for colour groupingpalms_edges_3_4 <- palms %>%select(level2, level3, level4) %>%unique() %>%rename(from = level3, to = level4) %>%mutate(subfam = level2) %>%# adding this column for colour groupingselect(-level2) edge_list <-rbind(palms_edges_1_2, palms_edges_2_3, palms_edges_3_4)palms_plot <-graph_from_data_frame(edge_list) %>%as_tbl_graph()
Define Fonts, Text, and Colours
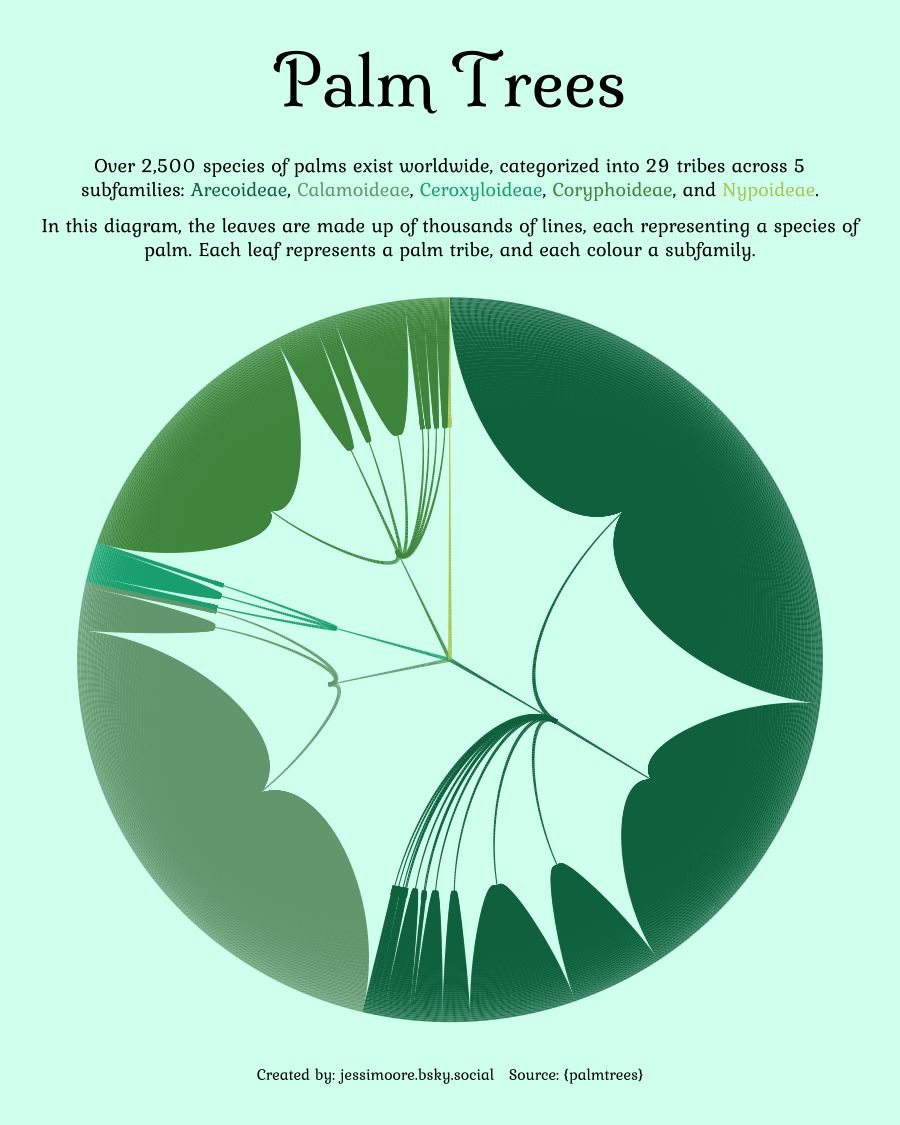
font_add_google("Milonga", "milonga")font_add_google("Kurale", "kurale")ft <-"milonga"ft2 <-"kurale"showtext_auto()title <-"Palm Trees"subtitle <-"Over 2,500 species of palms exist worldwide, categorized into 29 tribes across5 subfamilies: <span style = 'color: #04724d;'>**Arecoideae**</span>, <span style = 'color: #74a57f;'>**Calamoideae**</span>, <span style = 'color: #06AD81;'>**Ceroxyloideae**</span>, <span style = 'color: #4c934c;'>**Coryphoideae**</span>, and <span style = 'color: #b7ce63;'>**Nypoideae**</span>.\nIn this diagram, the leaves are made up of thousands of lines, each representing a species of palm.Each leaf represents a palm tribe, and each colour a subfamily."caption <-"Created by: jessimoore.bsky.social Source: {palmtrees}"c <-c("#04724d", "#74a57f", "#06AD81","#4c934c", "#b7ce63")