Load data and libraries
tuesdata <- tidytuesdayR::tt_load(2025, week = 38)

fide_ratings_august <- tuesdata$fide_ratings_august
fide_ratings_september <- tuesdata$fide_ratings_september

library(tidyverse)
library(ggtext)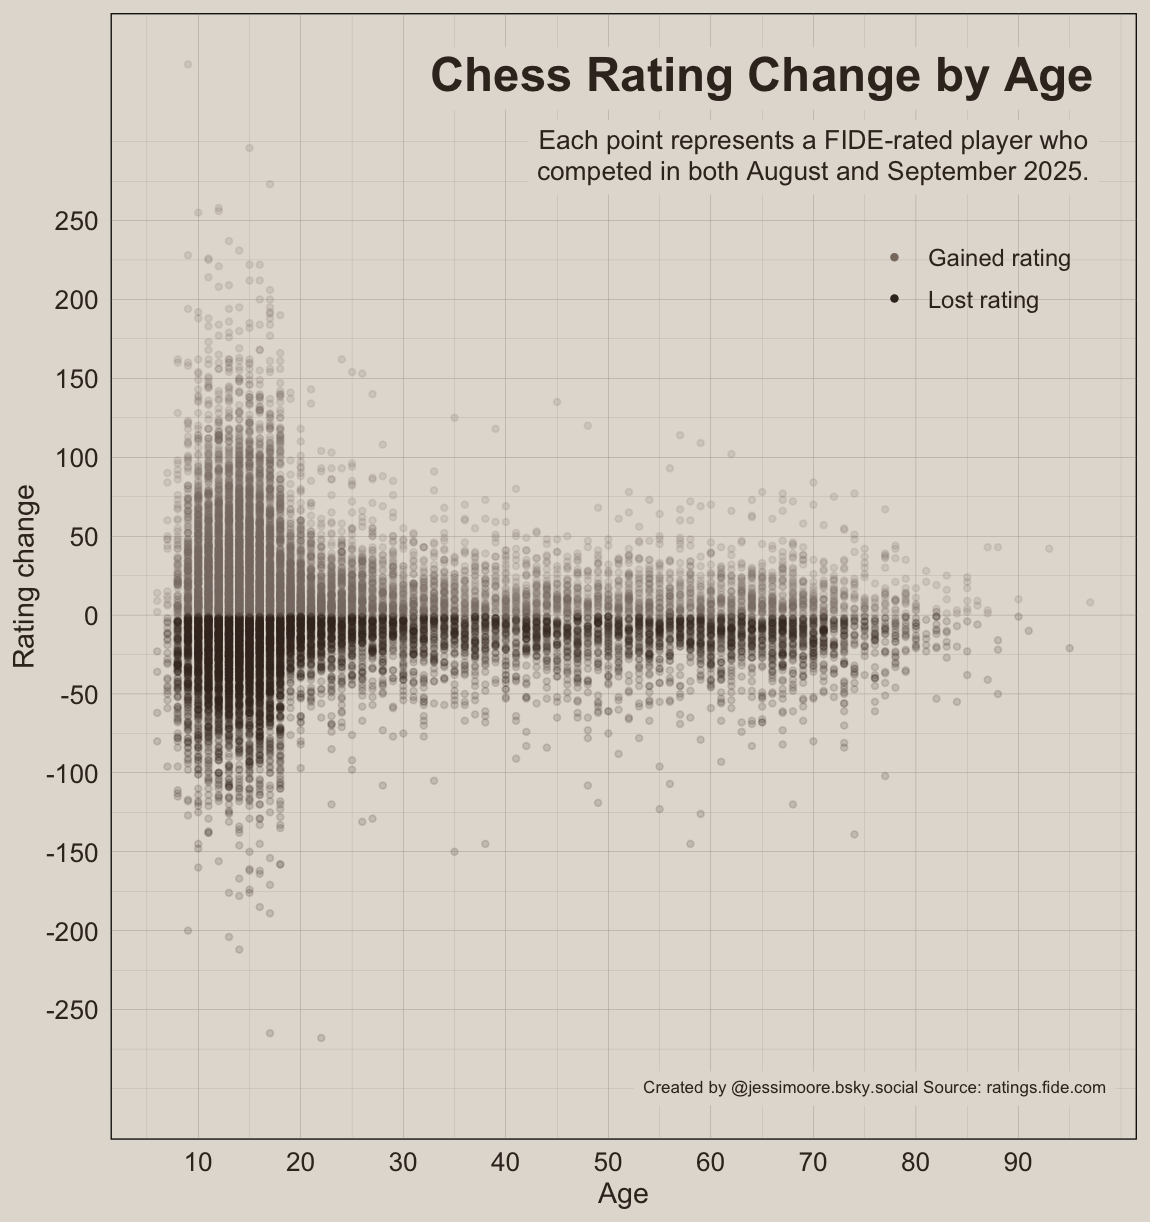
This week I was curious about the size of rating changes as chess players age. I expected to see that people lose more rating points as they age, but the reality is that rating is most volatile before people turn 20.
tuesdata <- tidytuesdayR::tt_load(2025, week = 38)
fide_ratings_august <- tuesdata$fide_ratings_august
fide_ratings_september <- tuesdata$fide_ratings_september
library(tidyverse)
library(ggtext)fide <- inner_join(fide_ratings_august,
fide_ratings_september,
by = c("name", "id", "fed", "sex", "bday"),
suffix = c("_aug", "_sep")) %>%
mutate(age = 2025 - bday,
rating_change = rating_sep - rating_aug) %>%
filter(rating_change != 0,
games_aug > 0,
games_sep > 0) %>%
mutate(value = case_when(
rating_change >= 0 ~ "Gained rating",
rating_change < 0 ~ "Lost rating"
))t <- "**Chess Rating Change by Age**"
st <- "Each point represents a FIDE-rated player who<br>competed in both August and September 2025."
c <- "Created by @jessimoore.bsky.social Source: ratings.fide.com"
bg <- "#E2DDD5"
text_color <- "#3B2F26"
values <- c("#887A6E", "#3B2F26")
plot <- ggplot(fide,
aes(x = age,
y = rating_change,
colour = value),
) +
geom_point(alpha = 0.15, size = 1) +
annotate("richtext",
x = 65, y = 340,
label = t,
size = 7,
fill = bg,
label.color = bg,
color = text_color) +
annotate("richtext",
x = 70, y = 290,
label = st,
fill = bg,
label.color = bg,
color = text_color) +
annotate("richtext",
x = 76, y = -300,
label = c,
size = 2.5,
fill = bg,
label.color = bg,
color = text_color) +
scale_x_continuous(breaks = c(10,20,30,40,50,60,70,80,90)) +
scale_y_continuous(breaks = c(-250, -200, -150, -100, -50, 0, 50, 100, 150, 200, 250)) +
scale_color_manual(values = values) +
guides(color = guide_legend(override.aes = list(alpha = 1))) +
labs(x = "Age", y = "Rating change",
color = NULL) +
theme_minimal() +
theme(panel.grid = element_line(color = "#887A6E", linewidth = 0.05),
plot.title = element_text(face = "bold"),
legend.position = "inside",
legend.position.inside = c(0.84,0.765),
legend.text = element_text(size = 10),
text = element_text(color = text_color),
axis.text = element_text(color = text_color, size = 11),
axis.title = element_text(size = 12),
plot.background = element_rect(fill = bg),
panel.background = element_rect(fill = bg))