library(tidyverse)
library(ggstar)
library(ggfx)
library(sysfonts)
library(showtext)
tuesdata <- tidytuesdayR::tt_load(2025, week = 39)
cranes <- tuesdata$cranes
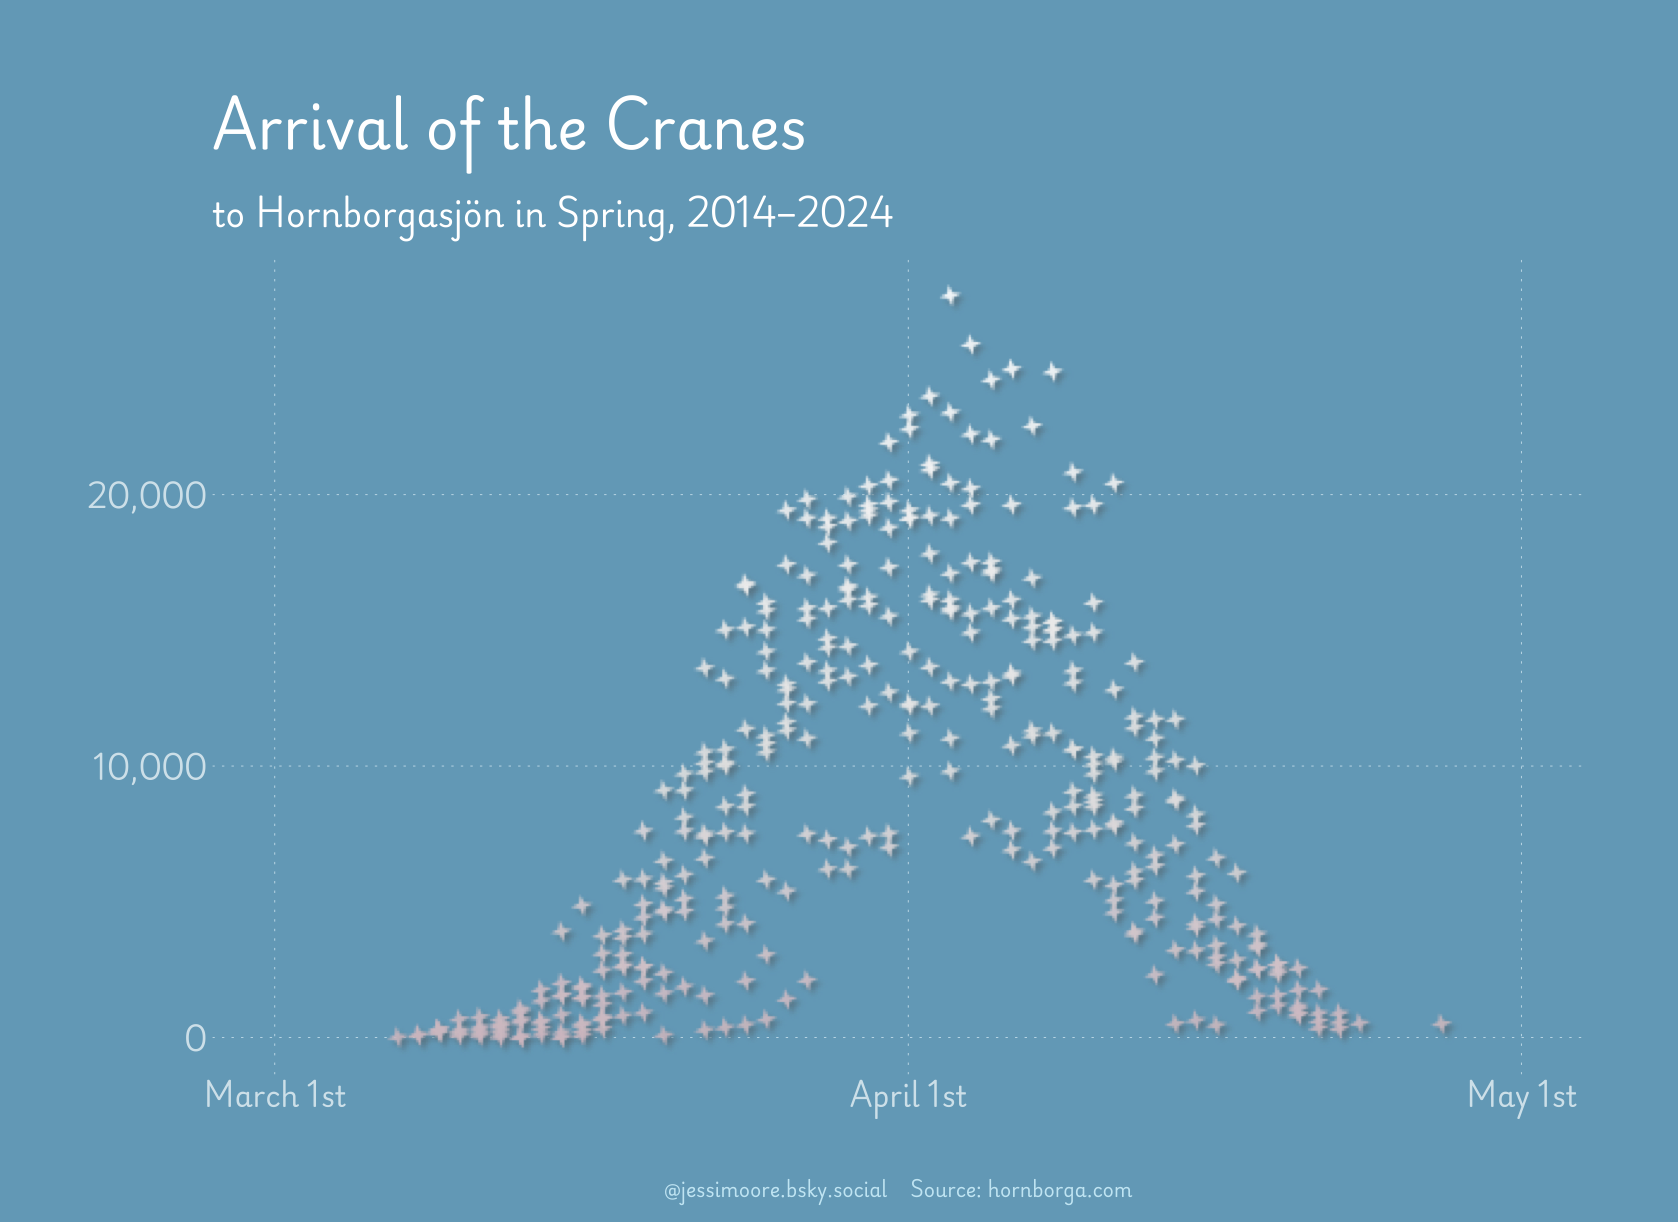
title <- "Arrival of the Cranes"
subtitle <- "to Hornborgasjön in Spring, 2014–2024"
caption <- "@jessimoore.bsky.social Source: hornborga.com"
font_add("playwrite", regular = "PlaywriteDEGrund-VariableFont_wght.ttf")
ft <- "playwrite"
showtext_auto()
cranes2 <- cranes %>%
drop_na(observations) %>%
mutate(date2 = as.Date(paste0("2025-", format(date, "%m-%d"))),
year = year(date)) %>%
filter(month(date) < 6,
year %in% 2014:2024)
p <- ggplot(cranes2,
aes(date2,
observations,
fill = observations)) +
with_shadow(geom_star(starshape = 14,
color = NA,
angle = -10,
size = 2.5,
alpha = 0.9),
colour = "#698796",
x_offset = 2,
y_offset = 2,
size = 1) +
scale_fill_gradientn(colors = c("#D4C3CA", "grey90","grey95", "white")) +
scale_x_date(limits = as.Date(c("2025-03-01",
"2025-05-01")),
breaks = as.Date(c("2025-03-01",
"2025-04-01",
"2025-05-01")),
labels = c("March 1st",
"April 1st",
"May 1st")) +
scale_y_continuous(labels = scales::label_comma()) +
labs(x = NULL, y = NULL,
title = title,
subtitle = subtitle,
caption = caption) +
theme_bw(ink = "white",
paper = "#74a9c2") +
theme(legend.position = "none",
panel.grid = element_blank(),
panel.grid.major.x = element_line(color = "#c1dbe8", linetype = "dotted", linewidth = 0.2),
panel.grid.major.y = element_line(color = "#c1dbe8", linetype = "dotted", linewidth = 0.2),
panel.border = element_blank(),
axis.ticks = element_blank(),
text = element_text(family = ft),
axis.text = element_text(size = 12),
plot.title = element_text(size = 24, face = "bold", hjust = 0),
plot.subtitle = element_text(size = 14),
plot.caption = element_text(size = 8, color = "#CAE9F5", hjust = 0.5, vjust = -2),
plot.margin = margin(40,40,20,20))